You don't know what your services call. Not completely.
You know the big ones — the database, the auth service, the payment gateway. But the full graph? The internal feature flag service someone wired into the critical path of every request? The "decommissioned" Redis cluster still getting 400 req/min?
I built Incidentary's ghost service detection to answer exactly this question. Here's what happens when you point it at a single service.
Setup
import { IncidentaryClient, createExpressMiddleware } from '@incidentary/sdk-node';

const incidentary = new IncidentaryClient({
  apiKey: process.env.INCIDENTARY_API_KEY!,
  serviceName: 'api-gateway',
});

app.use(createExpressMiddleware(incidentary));
The SDK patches http, https, and fetch automatically. Every outbound call gets captured — target hostname, duration, status code. Written to an in-memory ring buffer, flushed async. If Incidentary is down, your service doesn't notice.
Make a few requests. Wait 30 seconds.
What appears
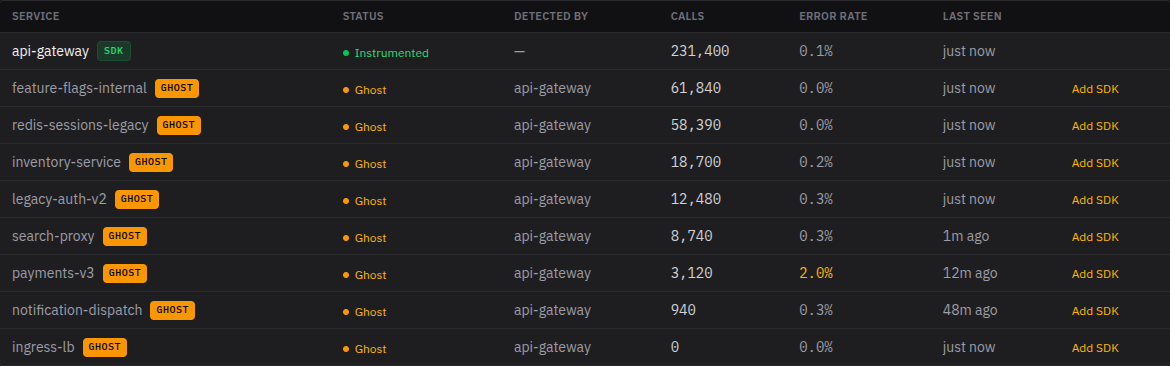
The service map shows your instrumented service as a solid node. Around it: every service it called, each shown as a dashed-outline ghost — detected but not instrumented.
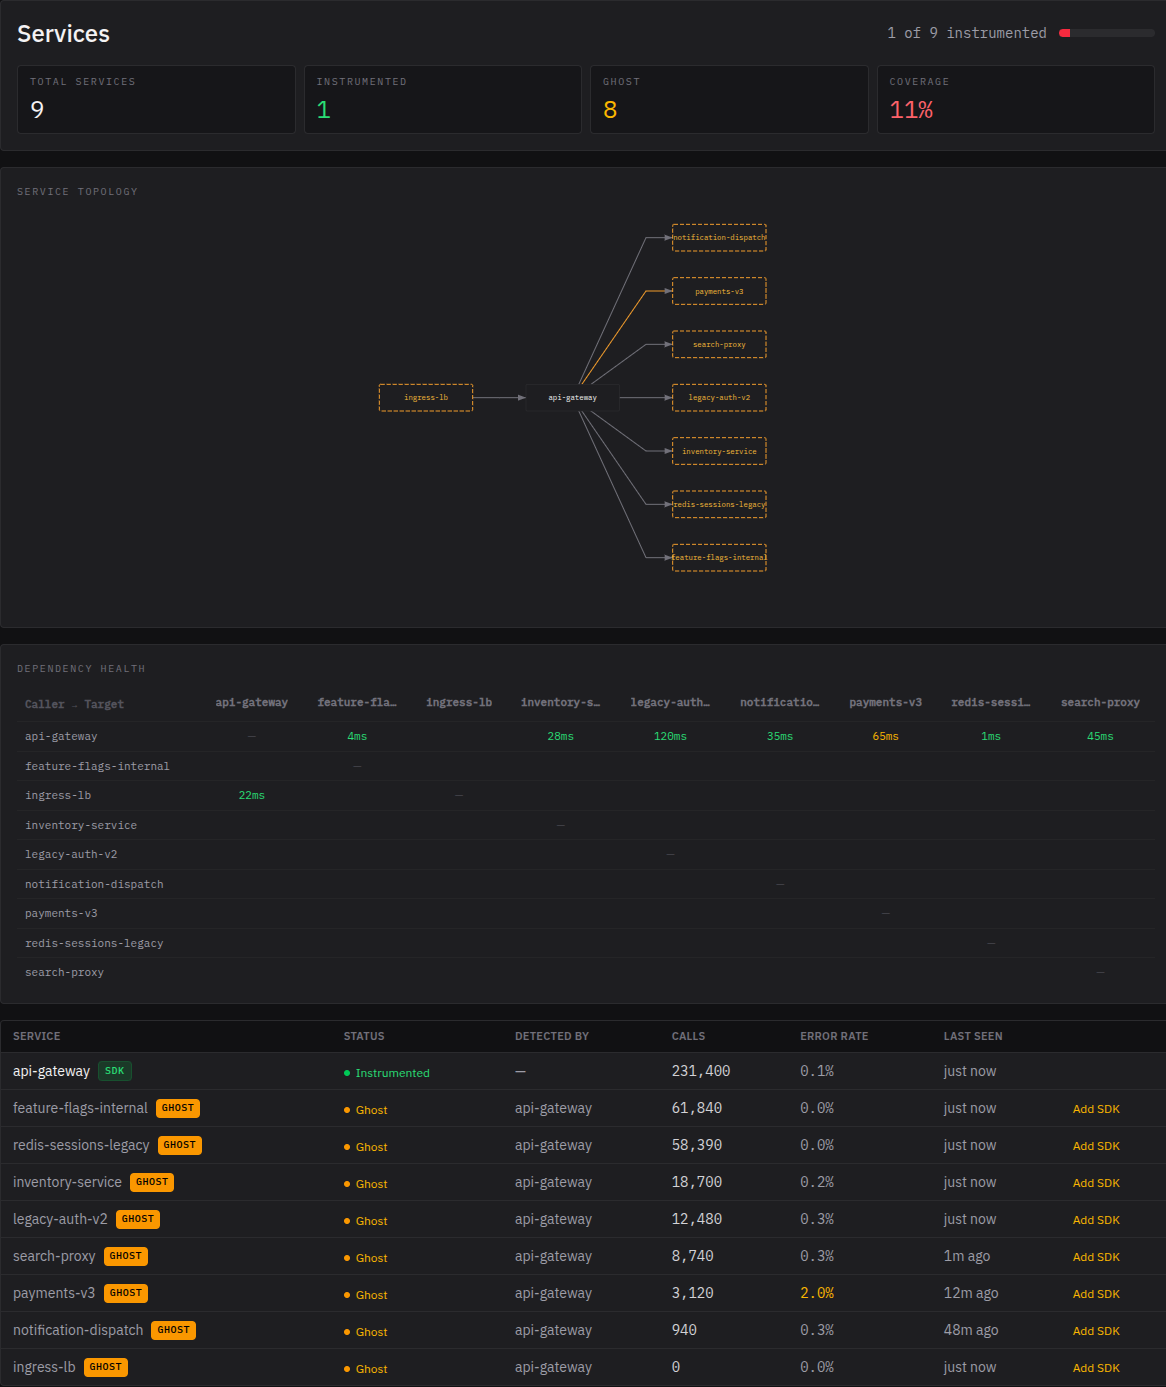
The graph is a star — you're seeing the world from one service's perspective. If payments-v3 calls inventory-service behind the scenes, that edge won't appear until one of them has the SDK. The topology fills in as teammates instrument their services.
For each ghost, you get caller-side metrics: p50 and p95 latency, error rate, call volume. All measured from the calling side — no SDK needed on the target.
This is what a static architecture diagram can't give you. Diagrams show what someone documented. Caller-side metrics show what's actually happening.
Why this matters
The mechanism is simple. Every outbound HTTP call includes a target_service derived from the request hostname. On ingest, Incidentary checks if that target exists in the service registry. If it doesn't, it's created as a ghost — is_instrumented = false, with the calling service recorded as the discoverer.
No batch jobs. No manual configuration. The graph builds itself from live traffic.
One service on a real codebase typically reveals 5–15 downstream dependencies. Some you know about. Some you forgot about. Some you'll stare at and wonder who put that there.
According to EMA research, only about 10% of organizations fully document their APIs. Spotify had 2,000+ backend services and coined the term "rumor-driven development" before building Backstage — because asking around was the only way to learn what called what. Google's Dapper paper put it plainly: "Engineers may not know which services are being transitively used by applications."
This isn't a niche problem. It's the default state.
What ghost services don't give you
The outside view only. You see latency and errors from the caller's perspective. You don't see what's happening inside the ghost — no internal timing, no database queries, no downstream calls from that service.
Gaps in the trace stay visible as gaps. Incidentary doesn't fill them with estimates. If you're debugging at 3am, you need to know what the tool actually observed vs. what it's guessing. We don't guess.
The expansion loop
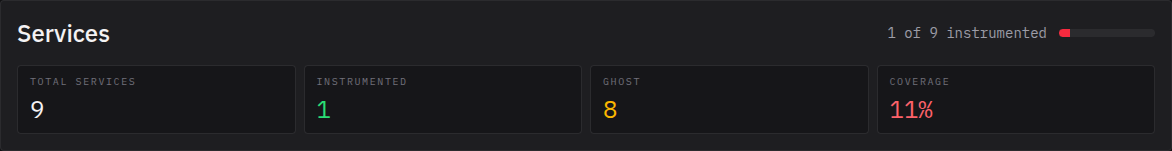
The coverage scorecard shows instrumented vs. total services. When someone shares a trace link during an incident, teammates see the ghost nodes — dashed borders, caller-side data, and a clear signal: "we can see this was called, but not what happened inside."
That's usually enough. In testing, it took about four days for the first teammate to instrument their service unprompted. Not because anyone asked — because they saw the gap in a real incident trace and wanted to close it.
Try it
npm install @incidentary/sdk-nodeFree tier: 200K causal events/month. A low-traffic service generates roughly 20–50K; a busy gateway will use more.